📡 How to Analyze On-Chain Data: 7 Powerful Metrics Every Crypto Investor Must Know (2025)
How to analyze on-chain data is a question every serious crypto investor must answer in 2025. Unlike stock markets, crypto offers a transparent look at real-time blockchain activity — if you know where to look.
At bit2050.com, we break down 7 actionable on-chain metrics you can use today to track whale behavior, market sentiment, and potential price reversals.
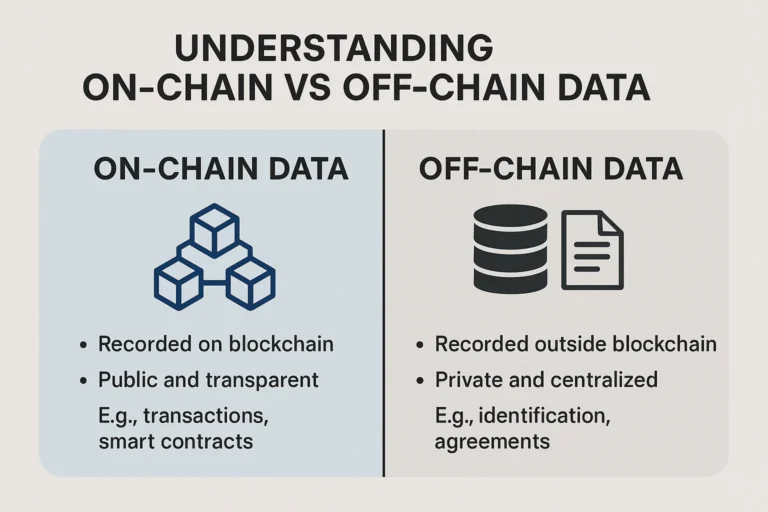
🧠 What Is On-Chain Data?
On-chain data refers to public information recorded directly on a blockchain. It includes:
This data is accessible, transparent, and often analyzed via platforms like Glassnode, Nansen, and CryptoQuant.
🔍 7 On-Chain Metrics to Watch in 2025
1. 🐋 Whale Wallet Movements
Large wallet addresses (holding thousands of BTC/ETH) are tracked for big inflows/outflows.
Why it matters: Sudden moves by whales often signal trend shifts.
2. 🚪 Exchange Inflows & Outflows
Rising inflows = people preparing to sell.
Rising outflows = people hodling or moving to cold storage.
3. 💰 Active Addresses
A spike in active addresses = growing user engagement or hype.
Decline = low interest or market cooling.
4. 🛠️ Miner and Staking Behavior
If miners start selling large amounts, it often causes downward price pressure.
Stakers locking more = bullish sentiment.
5. 🔄 Token Velocity
Velocity = how fast a token changes hands.
Higher velocity = short-term trading
Lower velocity = hodling
6. ⛓️ Network Value to Transaction Ratio (NVT)
A high NVT ratio = price is overvalued compared to usage.
Low NVT = undervalued opportunity.
7. 📉 Realized vs Market Cap (MVRV)
MVRV > 3 = overbought
MVRV < 1 = oversold
Used for Bitcoin, ETH, and major alts.
🧠 Useful Links
📚 Resources
❓ FAQ – How to Analyze On-Chain Data
Q1: Do I need coding knowledge to analyze on-chain data?
A: No. Tools like Glassnode and Nansen offer visual dashboards and charts for non-coders.
Q2: Is on-chain data reliable?
A: Yes, it’s public and verifiable. However, interpretation requires experience and context.
Q3: Can on-chain data predict price movement?
A: It can reveal early signs of shifts, but should be used with TA and macro analysis.
Q4: What’s the best free tool for on-chain analysis?
A: Glassnode offers a solid free tier; others like Santiment and Dune also provide limited access.
Q5: How often should I check on-chain data?
A: Weekly for long-term investing. Daily if you’re trading actively or swing trading.
✅ Final Thoughts
Knowing how to analyze on-chain data empowers you to trade with conviction, not guesswork. Whether you’re tracking smart money or preparing for market turns, these metrics give you a critical edge.
For more cutting-edge crypto tools and tutorials, explore bit2050.com — your blockchain guide for smart investing in 2025.